Music, Illustrated

art, analysis, audio
Signal processing meets music theory.
spectrograms
Gallery.|
I specialize in high resolution audio images. With semitone resolution, mapping the color wheel to the octave reveals tonal relationships. 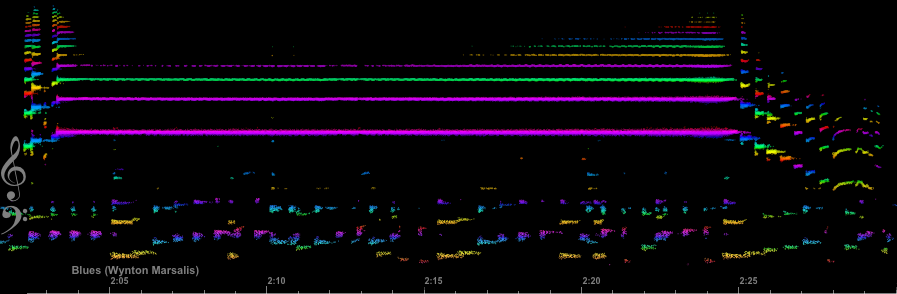 Wynton Marsalis, 'Blues' (detail) The bass register can be difficult to resolve. 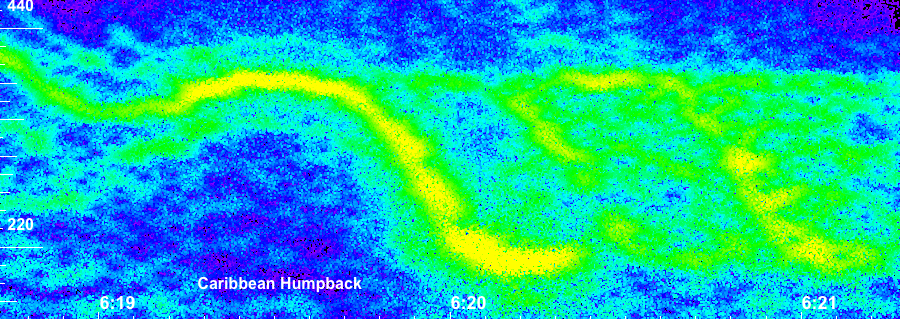 whale song (detail) Characteristic shapes recur, here's an intro. |
analysis
Spectral post-processing.
Calculating the spectral auto-correlation matrix (following this paper [fxpal.com]) benefits from sharp spectrograms.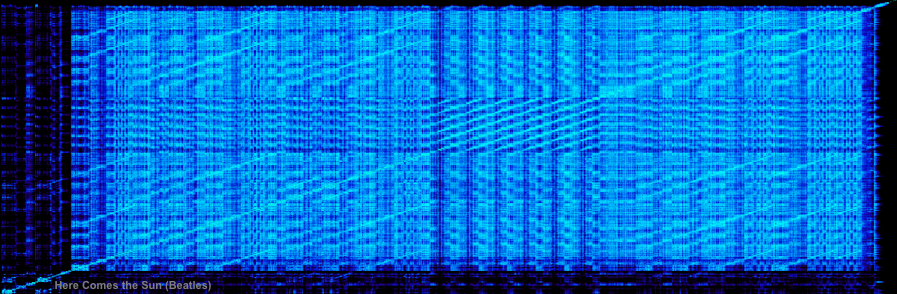 Beatles, 'Here comes the Sun', auto-correlation matrix. Easy to spot the break. More processing can produce a multi-resolution edge-detector: 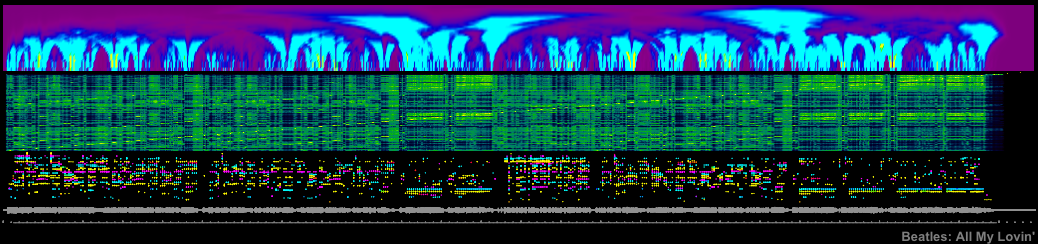 Beatles, 'All my Loving', spectrogram with auto-correlation matrix and edge detection. Which can be used for note and chord finding: 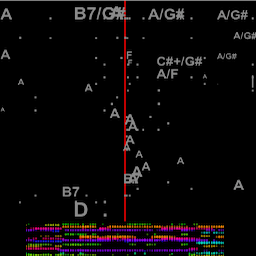 |
theory
Observations.
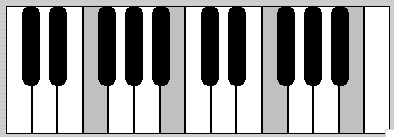 Black and white sets each are a pentatonic scale. Grey keys complete either set to a diatonic scale. 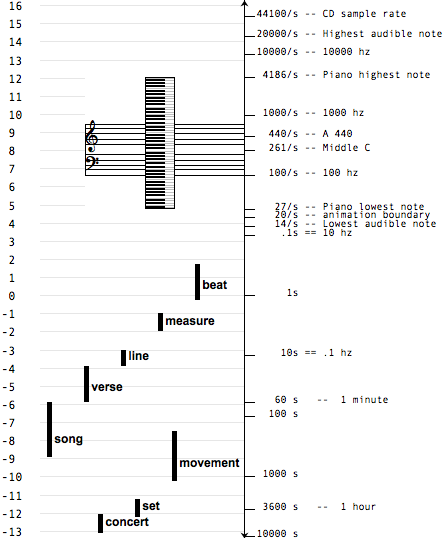 Frequency range chart  Available intervals by bandwidth 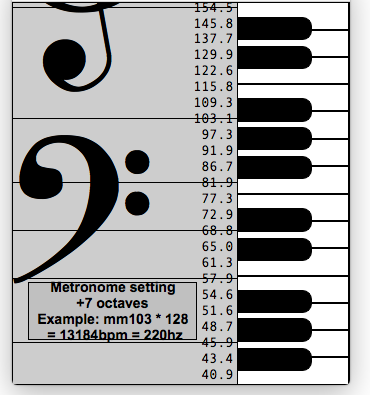 Key-tempo correspondences. I do not know if humans can hear this association. |
visualization
Music visualization videos can reveal subtle elements, and are fun to watch.Some examples.
contact: nedwaves at gmail dot com
© 2000-2020 N. Resnikoff